Interactive charts with StimulusReflex
When you are building spreadsheet replacement applications for business users, you will inevitably need to build charts and graphs to help users learn about trends in their account, share updates with executives, and use data to make decisions. Also, a certain segment of users just love looking at pretty charts.
In this chapter, we are going to use ApexCharts and StimulusReflex to add two sample charts to the account dashboard, tracking inbound applicant volume over time and presenting a snapshot of the account’s current hiring pipeline.
Users will be able to filter the charts in a variety of ways, with StimulusReflex handling updating the charts as the user changes their filters.
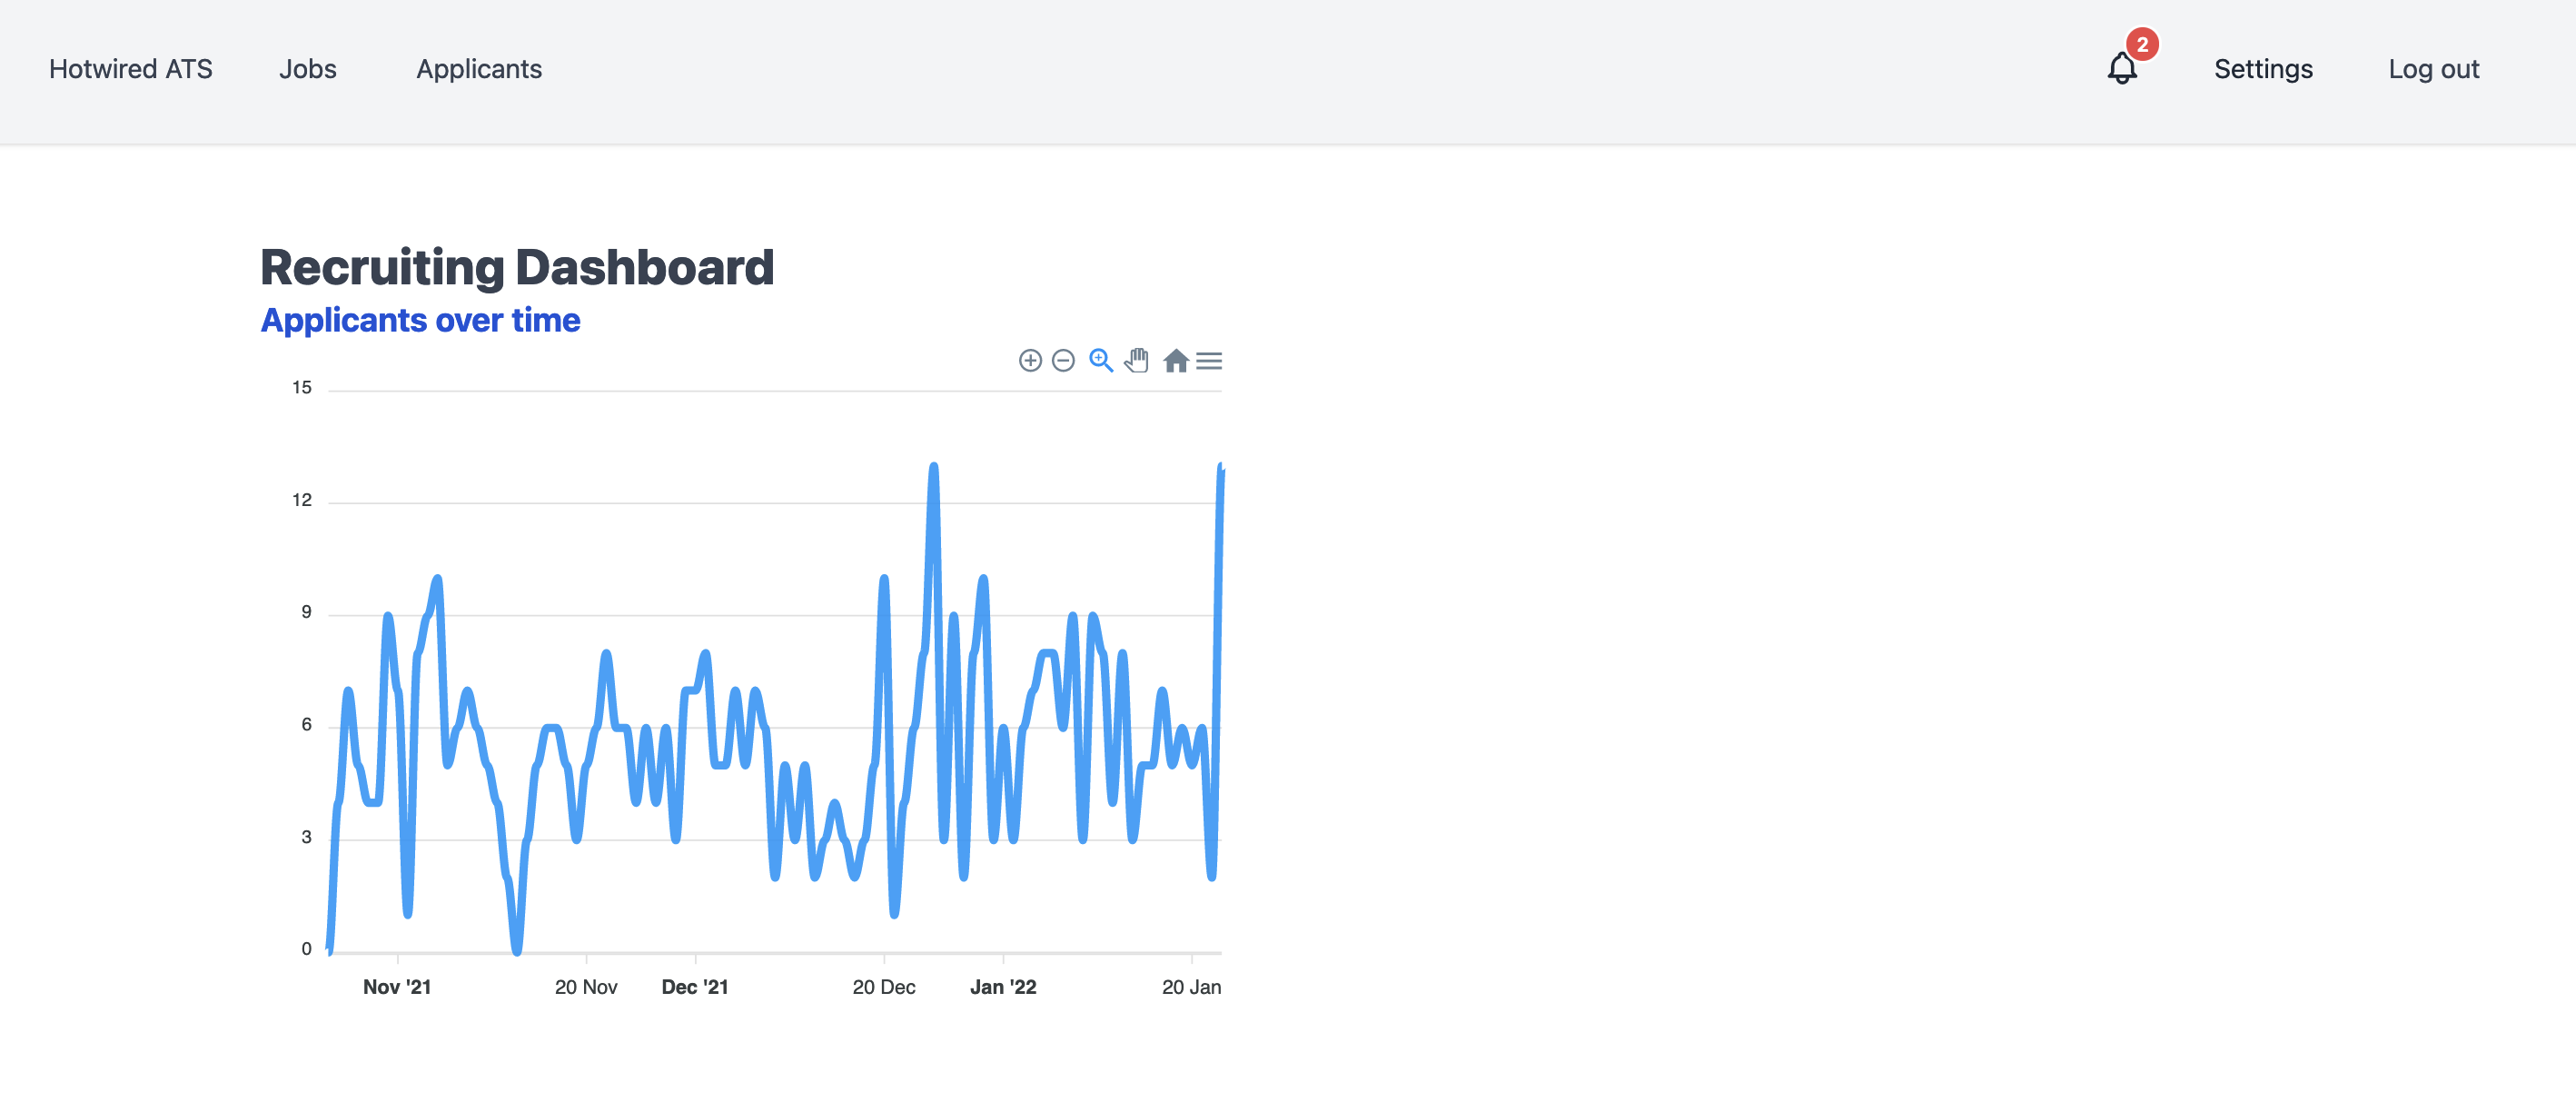
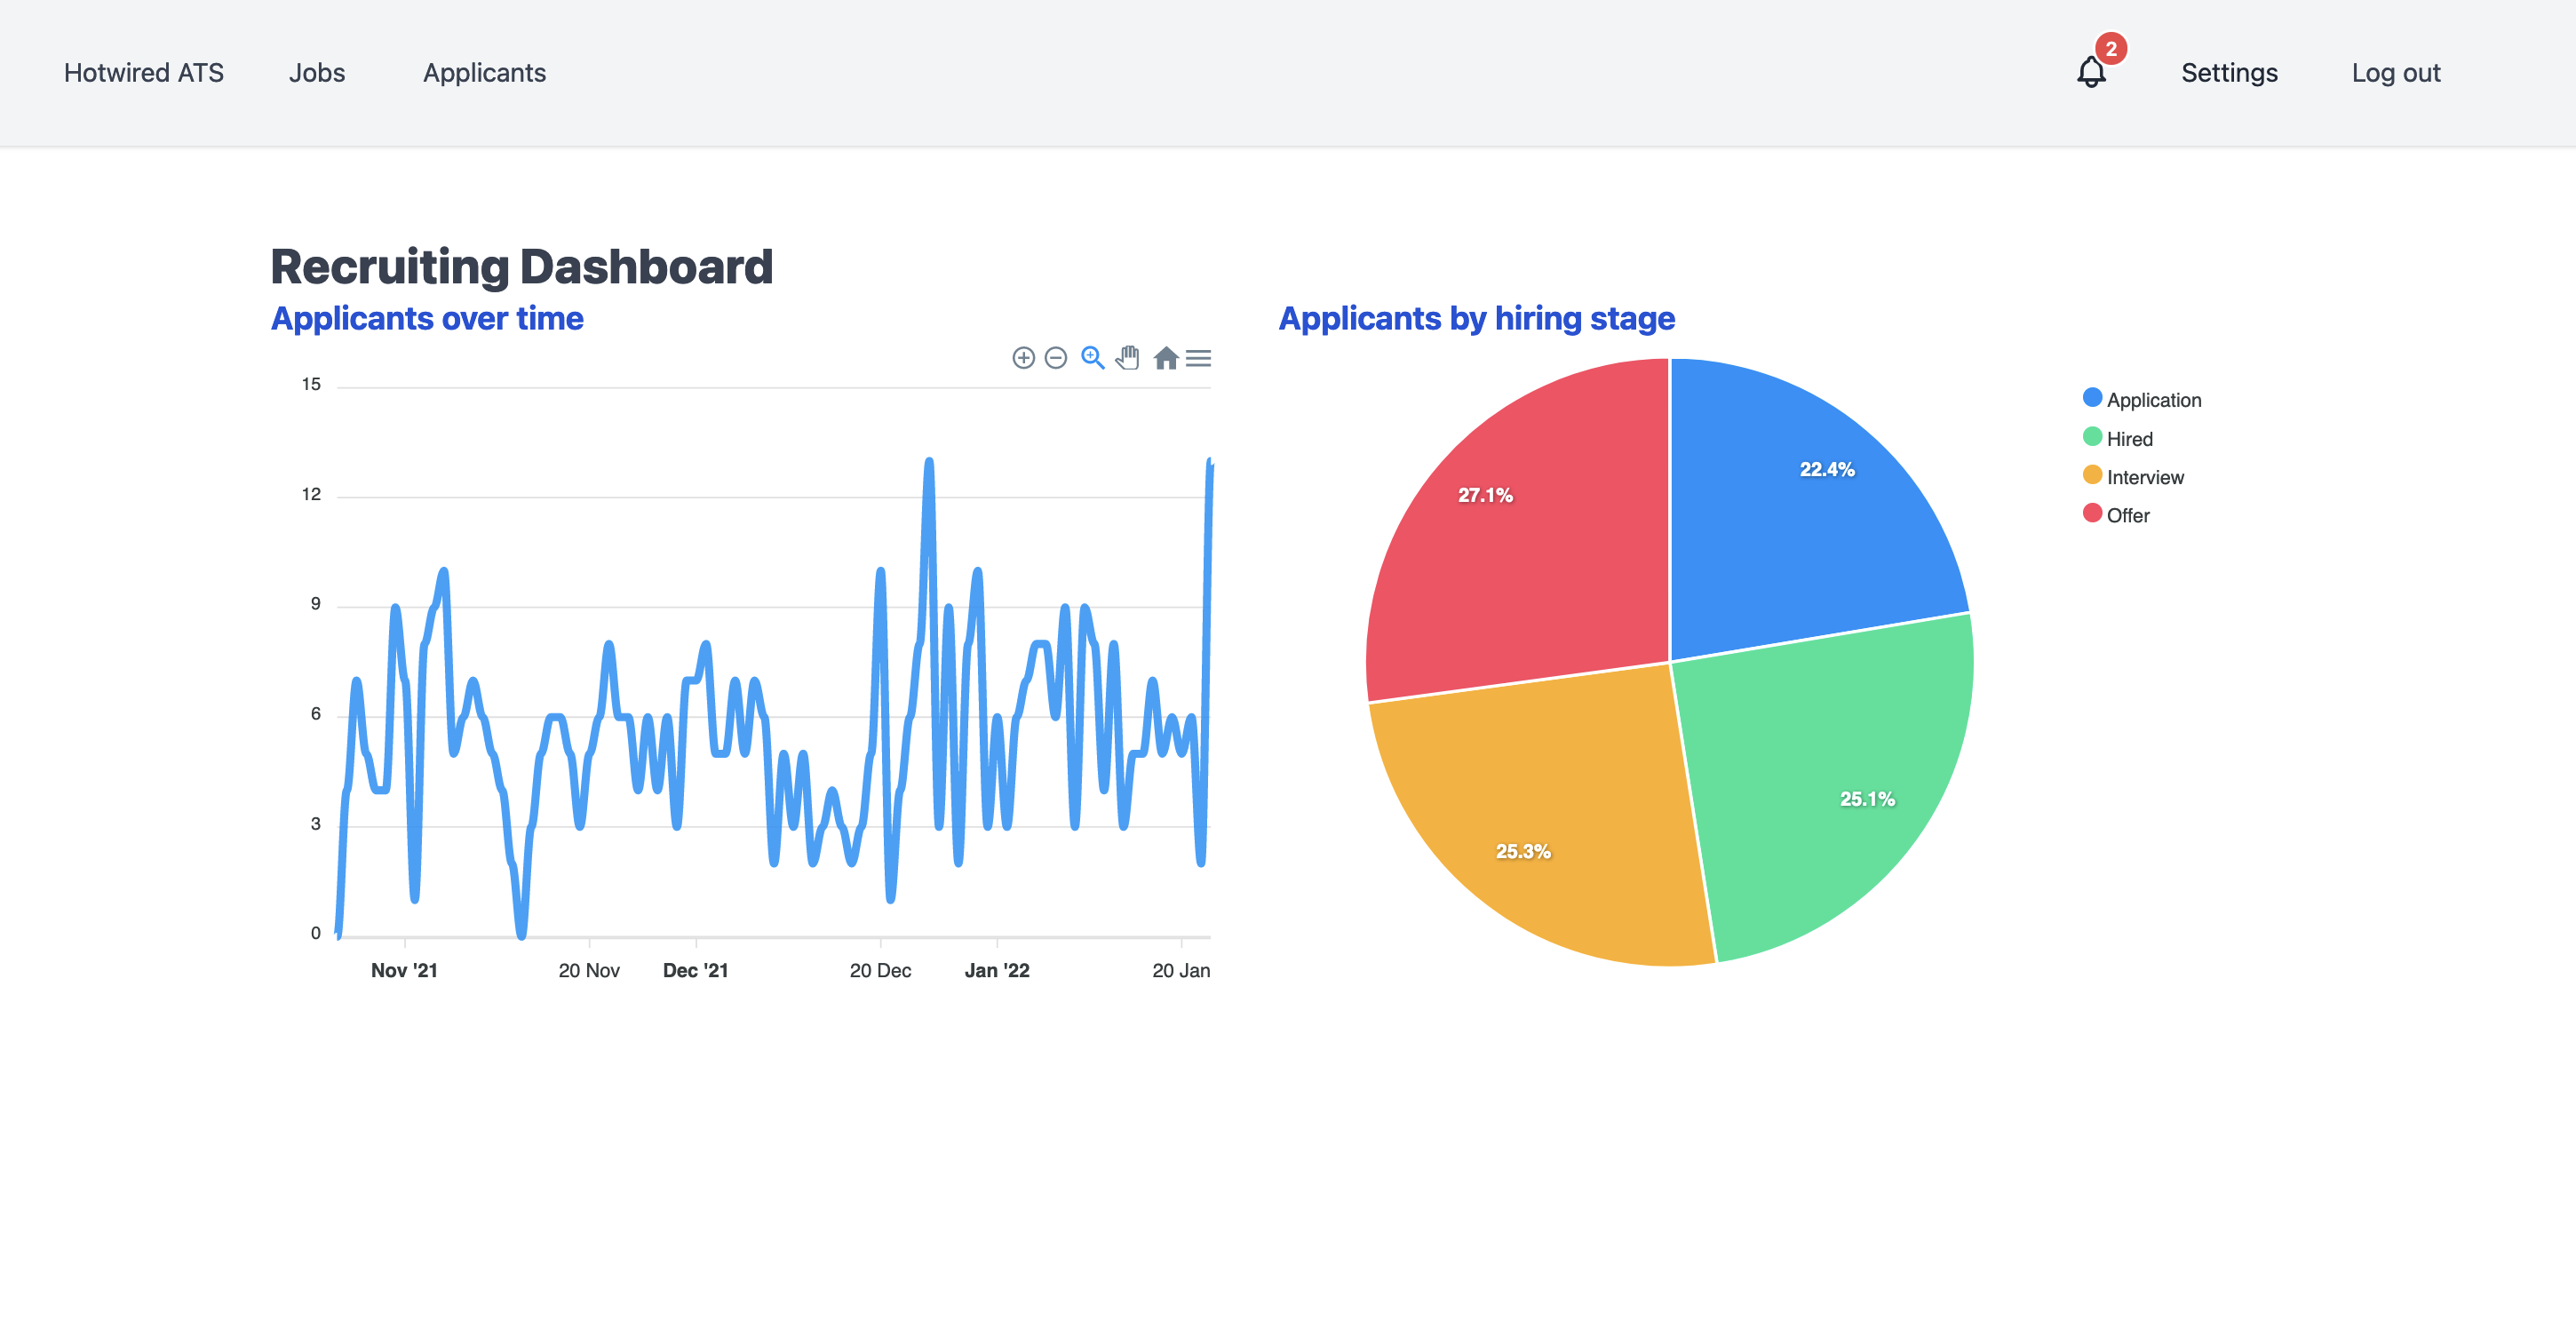
The finished version of the dashboard will look like this:
Applicants over time chart
The first chart we will build is a line chart displaying new applications received by day, with the day as the x-axis and the number of applications received that day as the y-axis.
Both charts will be created using ApexCharts. Install it from your terminal:
yarn add apexcharts
We will use StimulusReflex to handle initializing charts and re-rendering the chart when the user changes the chart filters.
First, create a new reflex from your terminal:
rails g stimulus_reflex applicants_chart
rails stimulus:manifest:update
Remember that generating a reflex creates both a server-side reflex (app/reflexes/applicants_chart_reflex.rb) and a client-side Stimulus controller (app/javascript/controllers/applicants_chart_controller.js). Update the Stimulus controller first:
import ApplicationController from './application_controller'
import ApexCharts from "apexcharts"

export default class extends ApplicationController {
  static targets = ["chart"]

  static values = {
    categories: Array,
    series: Array
  }

  initialize() {
    this.chart = new ApexCharts(this.chartTarget, this.chartOptions);
    this.chart.render();
  }

  get chartOptions() {
    return {
      chart: {
        height: "400px",
        type: 'line',
      },
      series: [{
        name: 'Applicants',
        data: this.seriesValue
      }],
      xaxis: {
        categories: this.categoriesValue,
        type: 'datetime'
      },
      stroke: {
        curve: "smooth"
      }
    }
  }
}
This controller imports the ApexChart package and initializes a new chart, using this.chartTarget to attach the chart to a DOM element.
The data for the chart is read from the DOM using the categories and series values.
chartOptions tells ApexCharts what type of chart we want to create. The options here are all well documented in the ApexCharts documentation.
We need to connect the Stimulus controller to the DOM. Update the dashboard show page:
Here we have the basic structure of the new dashboard page layout, rendering an applicants_chart partial that will display the chart we are building now and with a placeholder for the hiring pipeline chart we will build next.
Notice that we are passing @categories and @series to the applicants chart partial. We will set these values in the dashboard controller for our first pass at this feature.
The applicants_chart partial does not exist yet. Create it now from your terminal:
touch app/views/dashboard/_applicants_chart.html.erb
And fill the new partial in with:
This partial connects the applicants-chart controller to the DOM and adds an empty div with a chart target. This div will be populated with the chart from ApexCharts — recall the initialize function in applicants_chart_controller.js:
this.chart = new ApexCharts(this.chartTarget, this.chartOptions);
This is a common pattern when working with third party JavaScript libraries that attach behavior to the browser. Stimulus initializes the library, sets the needed options, and then uses initialize or connect lifecycle methods along with target elements to add the desired behavior on the front end.
Earlier in this book we used a very similar pattern to enable drag and drop with Sortablejs.
With the partial ready to go, next we need to update the DashboardController to populate the series and categories values for the chart.
Head to the DashboardController and update it:
class DashboardController < ApplicationController
  before_action :authenticate_user!

  def show
    report_data = Charts::ApplicantsChart.new(current_user.account_id).generate

    @categories = report_data.keys.to_json
    @series = report_data.values.to_json
  end
end
Here, we are calling a new Charts::ApplicantsChart class to run the queries needed for the applicants chart, and using the data the generate method returns to set the categories and series values, transformed to json for use by ApexCharts on the frontend.
Before this will work, we need to define the Charts::ApplicantsChart class. Create the class from your terminal:
mkdir app/models/charts
touch app/models/charts/applicants_chart.rb
And then update the new class:
class Charts::ApplicantsChart
  def initialize(account_id)
    @account_id = account_id
  end

  def generate
    applicants = query_data
    zero_fill_dates(applicants)
  end

  private

  def query_data
    Applicant
      .includes(:job)
      .for_account(@account_id)
      .where('applicants.created_at > ?', 90.days.ago)
      .group('date(applicants.created_at)')
      .count
  end

  def zero_fill_dates(applicants)
    (90.days.ago.to_date..Date.today.to_date).each_with_object({}) do |date, hash|
      hash[date] = applicants.fetch(date, 0)
    end
  end
end
Here we have a standard ActiveRecord query to fetch applicants that match the date range we are looking for (hard coded to the last 3 months, for now), grouped into a hash with the day the applicants were created as the keys and the number of applicants that applied that day as the values.
Then we use zero_fill_dates to populate the applicant data hash with any days that had zero applicants apply.
Application flow in an applicant tracking system can be very spiky. Especially when data is filtered down to a single job, having multiple days (or even weeks) in a row with zero applicants is common. Without this clean up step, our applicant flow chart could look very strange, with large chunks of time missing with no explanation.
With this new class defined and the DashboardController updated, we can head to http://localhost:3000/ and see our nice new line chart rendering.
You should generate some fake data for the applicants table to make the charts a little more interesting. You could use a tool like faker for this. Or, to keep things simple, you can run a script like this from the Rails console:
account = Account.first # whatever account you are testing with
500.times do |n|
  Applicant.create(first_name: 'Test', last_name: 'Test', email: "test#{n}@hotwiringrails.com", job: account.jobs.sample, stage: Applicant.stages.values.sample, created_at: rand(0..90).days.ago)
end
Before making this chart dynamic, let’s create the second chart for the dashboard.
Hiring stages chart
The second chart on the dashboard is a pie chart showing a current snapshot of how applicants are distributed between the four hiring stages, from application to hire.
Like the applicants chart, the hiring stages chart will rely on StimulusReflex. Generate the reflex from your terminal to get started:
rails g stimulus_reflex hiring_stages
rails stimulus:manifest:update
And then fill in the hiring_stages Stimulus controller:
import ApplicationController from './application_controller'
import ApexCharts from "apexcharts"

export default class extends ApplicationController {
  static targets = ["chart"]

  static values = {
    labels: Array,
    series: Array
  }

  initialize() {
    this.chart = new ApexCharts(this.chartTarget, this.chartOptions);
    this.chart.render();
  }

  get chartOptions() {
    return {
      chart: {
        type: 'pie',
        height: '400px'
      },
      series: this.seriesValue,
      labels: this.labelsValue,
    }
  }
}
This is very similar to the applicants chart controller, with different options and values.
Next, create the hiring_stages_chart class that we will use to query the database for the data we need to render the chart:
touch app/models/charts/hiring_stages_chart.rb
And fill that class in:
class Charts::HiringStagesChart
  def initialize(account_id)
    @account_id = account_id
  end

  def generate
    query_data
  end

  private

  def query_data
    Applicant
      .includes(:job)
      .for_account(@account_id)
      .group('stage')
      .count
  end
end
query_data returns a hash with stage names as the keys and the number of applicants in each stage as the values.
Update the DashboardController to build the data for the hiring stage chart:
class DashboardController < ApplicationController
  before_action :authenticate_user!

  def show
    report_data = Charts::ApplicantsChart.new(current_user.account_id).generate
    @categories = report_data.keys.to_json
    @series = report_data.values.to_json

    stage_data = Charts::HiringStagesChart.new(current_user.account_id).generate
    @stage_labels = stage_data.keys.map(&:humanize).to_json
    @stage_series = stage_data.values.to_json
  end
end
This action is getting a little messy. We will refactor it later in this chapter, but before refactoring our code, let’s get the charts fully functional.
Next up, add the hiring stages partial from your terminal:
touch app/views/dashboard/_hiring_stages_chart.html.erb
And fill the new partial in:
This is very similar to the applicants chart partial. Let’s render this partial on the Dashboard show page:
At this point, both of the charts we built display correctly when we visit the dashboard, but there is no way for the user to interact with them.
Charts are not very useful unless they can be adjusted to drill down (or zoom out) to the data the user cares about. Fortunately, with a little bit more StimulusReflex we can add filtering options to both charts. Let’s tackle the hiring stages chart first.
Filter hiring stages chart
Most of the time, a user in an applicant tracking system is not interested in all of the data in their account. Instead, they are often interested in what is happening with a single job or type of job. In this section, we are going to add a job filter to the hiring stage chart so that users can see the current hiring stage breakdown for applicants in one job at a time.
Begin by updating the hiring stages partial to add a form with a select input above the chart:
Notice that the form tag does not have an action. This is because we are never actually going to submit this filter form. Instead, in the select tag, we have a data-action attribute that triggers hiring-stages#update each time the input changes.
Next, define update in the hiring stages Stimulus controller:
update(event) {
  this.stimulate("HiringStages#update", event.target, { serializeForm: true })
}

afterUpdate() {
  this.chart.updateOptions(this.chartOptions);
}
update triggers the server-side HiringStages#update method, passing in the element that triggered the update call. In this case, event.target because the change event on that input is what triggers the update method. We also include the serializeForm option, which, combined with our dummy <form> tag in the markup, allows us to easily access the current values of all form inputs in the server-side reflex.
afterUpdate uses StimulusReflex lifecycle callbacks to trigger ApexCharts' updateOptions method which will cause the chart to re-render in the UI after the update reflex runs.
Let’s see what this looks like on the server-side now.
First, we need to update the Charts::HiringStagesChart class to handle the new job filter option. Update HiringStagesChart like this:
class Charts::HiringStagesChart
  def initialize(account_id, job_id = nil)
    @account_id = account_id
    @job_id = job_id
  end

  def generate
    query_data
  end

  def query_data
    Applicant
      .includes(:job)
      .for_account(@account_id)
      .for_job(@job_id)
      .group('stage')
      .count
  end
end
Here, we added the job_id parameter to the initialize method and then updated query_data to use the existing for_job scope. We added this scope back in the chapter on filtering the applicants page and it works perfectly for this purpose too.
Head to app/reflexes/hiring_stages_reflex.rb:
class HiringStagesReflex < ApplicationReflex
  def update
    data = retrieve_data(params[:job_id])
    stage_labels, stage_series = assign_data(data)

    cable_ready
      .set_dataset_property(name: 'hiringStagesLabelsValue', selector: '#stage-chart-container', value: stage_labels)
      .set_dataset_property(name: 'hiringStagesSeriesValue', selector: '#stage-chart-container', value: stage_series)
      .broadcast

    morph :nothing
  end

  def retrieve_data(job_id)
    Charts::HiringStagesChart.new(current_user.account_id, job_id).generate
  end

  def assign_data(data)
    [data.keys.map(&:humanize).to_json, data.values.to_json]
  end
end
retrieve_data and assign_data fetch the data we need to build the chart. Once the data is ready, CableReady’s set_dataset_property operation allows us to update the hiring-stages-labels and hiring-stages data attributes in the DOM.
Since ApexCharts uses those data attributes to display the chart’s data, all we need to change are those two attributes. Once we broadcast those operations, we finish the reflex with a nothing morph.
After this reflex runs, the afterUpdate callback in the Stimulus controller runs and, because we updated the data attributes during the reflex, the chart updates with the new data.
Thanks to ApexCharts, it also nicely animates the transition:
Magical.
Next, add a date range filter to the applicants chart. This filter will allow users to view data for a specific period of time.
Filter applicants chart
We do not want to ask our users to figure out how to type in valid dates for the date range filter, so we will add flatpickr to the project to build usable date picker inputs. Helpfully, there is a Stimulus flatpickr wrapper, which we will use to interact with flatpickr.
Add both of those projects, and create a new Stimulus controller from your terminal:
yarn add stimulus-flatpickr flatpickr
rails g stimulus flatpickr
And then import the flatpickr css into app/assets/stylesheets/application.tailwind.css:
@import "flatpickr/dist/flatpickr.css"
Head to the new flatpickr_controller and update it:
import Flatpickr from 'stimulus-flatpickr'

export default class extends Flatpickr {
  static targets = ["start", "end"]

  connect() {
    flatpickr(this.startTarget)
    flatpickr(this.endTarget)
  }

  disconnect() {}
}
The flatpickr controller expects a start and end target, and initializes both targets as flatpickr inputs.
We use separate start and end targets since we may want to interact with those inputs separately in the future.
Update the applicants_chart partial to add the date range filter options with flatpickr connected to the inputs:
Similar to the hiring stages chart, we have a dummy form wrapping the inputs. Both inputs are connected to the flatpickr controller, and both have the same data-action to trigger applicants-chart#update on change events.
Update the applicants chart Stimulus controller to add the update and afterUpdate methods:
update() {
  this.stimulate('ApplicantsChart#update', event.target, { serializeForm: true })
}

afterUpdate() {
  this.chart.updateOptions({
    series: [{
      data: this.seriesValue
    }],
    xaxis: {
      categories: this.categoriesValue
    }
  });
}
Hopefully this looks very familiar. Update the ApplicantsChartReflex:
class ApplicantsChartReflex < ApplicationReflex
  def update
    report_data = retrieve_data(current_user.account_id, params)
    categories, series = assign_data(report_data)

    cable_ready
      .set_dataset_property(name: 'applicantsChartCategoriesValue', selector: '#applicants-chart-container', value: categories)
      .set_dataset_property(name: 'applicantsChartSeriesValue', selector: '#applicants-chart-container', value: series)
      .broadcast

    morph :nothing
  end

  def retrieve_data(account_id, params)
    Charts::ApplicantsChart.new(account_id, params).generate
  end

  def assign_data(data)
    [data.keys.to_json, data.values.to_json]
  end
end
Seeing a pattern here, right? Query for the data and then use CableReady broadcasts to update the data-attributes in the DOM.
We are passing in params to the ApplicantsChart. We need to update the ApplicantsChart to use the passed in params:
class Charts::ApplicantsChart
  def initialize(account_id, params = {})
    @account_id = account_id
    @start_date = params[:start_date].presence || default_start_date
    @end_date = params[:end_date].presence || Date.today.end_of_day
  end

  def generate
    applicants = query_data
    zero_fill_dates(applicants)
  end

  def query_data
    Applicant
      .includes(:job)
      .for_account(@account_id)
      .where(applicants: { created_at: @start_date..@end_date })
      .group('date(applicants.created_at)')
      .count
  end

  def zero_fill_dates(applicants)
    (@start_date.to_date..@end_date.to_date).each_with_object({}) do |date, hash|
      hash[date] = applicants.fetch(date, 0)
    end
  end

  def default_start_date
    90.days.ago
  end
end
Here, we added the @start_date and @end_date instance variables. These instance variables are read from params when present and otherwise falling back to default values.
We also updated query_data to use the @start_date and @end_date values.
Whew. With that last piece in place, we can now visit the dashboard and apply a start and end date to the applicants chart and, if all has gone well, the chart will update automatically as we apply the filters.
Great work on this! We will finish up this chapter — and this book! — by refactoring our code a bit. Right now, our controller action is doing more than it should, and we have a lot of duplicate code between the applicants chart and the hiring stages chart.
Refactoring charts
Our charts work — they display on the dashboard and users can change the filters and get updated data right away — but we have a few things we can do to make the experience better for us as developers and for our users.
The first thing you may have noticed is that when compared to all of the other pages in the application, the dashboard is slow. If you add a few thousands applicants to the database visiting the dashboard starts to drag a bit, even in a development environment.
We can speed up the initial visit to the dashboard by moving the charts out into their own turbo lazy-loaded turbo frames. This move will also have the benefit of cleaning up the dashboard show controller which is already pretty messy with only two charts to display.
To move the charts to lazy loaded turbo frames, we need to create a route to use for the src value for the turbo frame. To handle this new requirement, start with a new controller.
From your terminal:
rails g controller Charts show
And then update the routes file to name the charts#show route for convenience:
get 'charts/show', as: :chart
Fill in the new ChartsController:
class ChartsController < ApplicationController
  before_action :set_chart
  before_action :authenticate_user!

  def show
    report_data = @chart.constantize.new(current_user.account_id).generate
    @labels = report_data.keys.to_json
    @series = report_data.values.to_json
    @chart_partial = chart_to_partial
  end

  private

  def set_chart
    @chart = params[:chart_type]
  end

  def chart_to_partial
    @chart.gsub('Charts::', '').underscore
  end
end
The controller has just one action, show, which uses a little Ruby magic to render any chart we add to our application.
The first key piece to notice is the @chart.constantize.new call in show. We are going to pass a string representation of the class name of the chart we want to render as the chart_type param. constantize converts that string to a Ruby class so we can then instantiate a new instance of the class and generate new chart data.
The other piece of Ruby that’s important to catch is the chart_to_partial method, where we again use the chart_type params to translate the chart into a matching partial path. We will use @chart_partial on the front end to render the matching partial in charts/show.html.erb
Let’s see that in action by updating the charts show view:
We use the @chart_partial instance variable to render the right partial and, importantly, we also use it to set the id for the Turbo Frame that should be replaced each time charts#show is rendered.
Next, update app/views/dashboard/show.html.erb to replace the inline charts with lazy loaded Turbo Frames pointing to charts#show:
Note that we have two Turbo Frames now, one for each chart. Each frame has an id that will match the @chart_partial value for the chart, and each frame sets the src value to point to charts#show with the correct chart_type param.
Now that the Dashboard is rendering empty Turbo Frames on the initial page load, we can update the DashboardController like this:
class DashboardController < ApplicationController
  before_action :authenticate_user!

  def show; end
end
The DashboardController now just renders the show view without querying for chart data.
Move the chart partials from the dashboard to the charts directory:
mv app/views/dashboard/_applicants_chart.html.erb app/views/charts
mv app/views/dashboard/_hiring_stages_chart.html.erb app/views/charts
Because we standardized the names of the instance variables in the ChartsController to be @labels and @series, we need to update those references in the chart partials. First, update app/views/charts/_applicants_chart.html.erb:
And then update the hiring stages chart partial:
Finally, we also changed the name of the categories value to labels in the applicants_chart partial, so we need to update the Stimulus controller and reflex to match:
First the ApplicantsChart Stimulus controller>:
import ApplicationController from './application_controller'
import ApexCharts from "apexcharts"

export default class extends ApplicationController {
  static targets = ["chart"]

  static values = {
    labels: Array,
    series: Array
  }

  initialize() {
    this.chart = new ApexCharts(this.chartTarget, this.chartOptions);
    this.chart.render();
  }

  update() {
    this.stimulate('ApplicantsChart#update', event.target, { serializeForm: true })
  }

  afterUpdate() {
    this.chart.updateOptions({
      series: [{
        data: this.seriesValue
      }],
      xaxis: {
        categories: this.labelsValue
      }
    })
  }

  get chartOptions() {
    return {
      chart: {
        height: "400px",
        type: 'line',
      },
      series: [{
        name: 'Applicants',
        data: this.seriesValue
      }],
      xaxis: {
        categories: this.labelsValue,
        type: 'datetime'
      },
      stroke: {
        curve: "smooth"
      }
    }
  }
}
And then the corresponding reflex:
- .set_dataset_property(name: 'applicantsChartCategoriesValue', selector: '#applicants-chart-container', value: categories)
+ .set_dataset_property(name: 'applicantsChartLabelsValue', selector: '#applicants-chart-container', value: categories)
With that last update, head to the dashboard page and see that the charts load in after the initial page load and that we can still update them with the filter options.
In the next section, we will DRY up our Stimulus controllers a bit by extending controllers.
Base charts controller
Right now, both the applicants_chart and hiring_stages_chart Stimulus controller have a significant amount of identical code. Both import the ApexCharts library, both declare the same targets and values, and they have identical initialize methods.
Instead of duplicating that code across every chart, we can instead move that shared behavior to a new charts Stimulus controller, which the applicants_chart and hiring_stages_chart can then extend to share behavior while defining their own options and update methods.
To get started, generate a new Stimulus controller from your terminal:
rails g stimulus charts
And then update that new controller to pull in the shared code from the existing applicants_chart and hiring_stages_chart:
import ApplicationController from './application_controller'
import ApexCharts from "apexcharts"

export default class extends ApplicationController {
  static targets = ["chart"]

  static values = {
    labels: Array,
    series: Array
  }

  initialize() {
    this.chart = new ApexCharts(this.chartTarget, this.chartOptions);
    this.chart.render();
  }

  afterUpdate() {
    this.chart.updateOptions(this.chartOptions);
  }
}
Now update the two chart-specific controllers to remove the shared code and extend the ChartsController.
First the ApplicantsChart Stimulus controller:
import ChartsController from './charts_controller'

export default class extends ChartsController {
  update() {
    this.stimulate('ApplicantsChart#update', event.target, { serializeForm: true })
  }

  get chartOptions() {
    return {
      chart: {
        height: "400px",
        type: 'line',
      },
      series: [{
        name: 'Applicants',
        data: this.seriesValue
      }],
      xaxis: {
        categories: this.labelsValue,
        type: 'datetime'
      },
      stroke: {
        curve: "smooth"
      }
    }
  }
}
And then HiringStagesChart Stimulus controller:
import ChartsController from './charts_controller'

export default class extends ChartsController {
  update(event) {
    this.stimulate("HiringStages#update", event.target, { serializeForm: true })
  }

  get chartOptions() {
    return {
      chart: {
        type: 'pie',
        height: '400px'
      },
      series: this.seriesValue,
      labels: this.labelsValue,
    }
  }
}
In both controllers, we swapped the imports out with a single import ChartsController and then removed the targets, values, the initialize method, and the afterUpdate method all of which are now provided by the ChartsController.
With these changes in place, head back to the dashboard one last time and see that everything still works exactly as it did before.
In the last section of this chapter, we will resolve a few nagging issues with charts in the UI.
Cleaning up chart behavior
Our charts work great, but you might notice that there are two subtle issues with our implementation.
First, after you navigate away from the Dashboard to another page, if you check the JavaScript console in your dev tools, you will see some errors thrown by ApexCharts:
These errors happen because we are not properly tearing down the charts when we navigate away from the page, so ApexCharts does not know the chart elements no longer exist. We can fix this by updating the ChartsController to destroy the chart when the charts leave the DOM:
disconnect() {
  this.chart.destroy();
}
disconnect() is a built-in Stimulus lifecycle method that is called when the Stimulus controller is removed from the DOM. In it, we use the destroy method from the ApexCharts library to remove the chart element and associated event listeners.
After making this change, refresh the Dashboard and then navigate away from the Dashboard to another page in the application and see that the ApexChart errors are no longer thrown in the JavaScript console.
The second issue occurs if you leave Dashboard and then come back. When you do this, you may notice that the charts flicker. They briefly render fully loaded and then they disappear and animate in like we expect them to when a user visits the page. The flickering does not prevent the charts from working, but it is pretty distracting!
This issue is caused by Turbo caching the charts before navigating away from the Dashboard. Turbo caches the final, fully rendered svg of the chart and then, when the user visits the Dashboard again, the cached svg is rendered momentarily before the Stimulus controller reinitializes ApexCharts and the chart is re-rendered.
To resolve this flickering issue, we need to tell Turbo Drive to opt the charts out of caching so that they are always rendered from scratch. We can do this by adding a data-turbo-cache attribute to both chart elements. This data attribute tells Turbo not to cache the element, as described in the documentation.
First, in app/views/charts/_applicants_chart.html.erb:
And then in app/views/charts/_hiring_stages_chart.html.erb:
In both cases, we added the data-turbo-cache="false" to the chart element. With this change in place, refresh the Dashboard, then navigate away from the Dashboard to another page, and then come back to the Dashboard. You should see the charts animate in as expected with no flickering. Incredible.
Turbo Drive's caching is usually very helpful. Every now and then, you need to adjust the behavior and Turbo offers a variety of ways to fine-tune caching behavior. It is worthwhile to review the Turbo documentation on caching in full.
Great work in this chapter! We have one chapter left in this book. In it, we will add the ability for users to comment on applicants and, to make things more interesting, we will use StimulusReflex to allow users to mention other users in those comments. This chapter will give us a chance to test our Stimulus and StimulusReflex knowledge and to try out the reusability of the Notification system we built earlier in the book.
To see the full set of changes in this chapter, review this pull request on Github.
| Change | Date | PR link |
|---|---|---|
Added the Cleaning up chart behavior section, adding fixes for chart flickering and tearing down charts with disconnect to prevent JavaScript console errors when leaving the Dashboard.
|
March 1, 2022 | PR 18 on Github |